Please enter the terms you'd like to search.
Empower Teams: Monitor Actions, Optimize Performance
Software Issue Manager empowers you to monitor actions, identifying who does what, how, and when. Track the performance of both projects and team members, fostering the development of superior software and ensuring satisfied customers. Access comprehensive Project and Member Dashboards for insightful analytics and enhanced project management.
Unlock Hidden Potential, Build Better Software, and Keep Customers Smiling
Software Issue Manager provides real-time insight into member performance and project progress through member-specific and project-specific dashboards. Here's an overview of the charts included in these dashboards:
Member-Specific Dashboards:
Issue Counts By Priority:
- This chart provides a visual representation of the counts of issues categorized by priority for a specific member. It allows for a quick assessment of the distribution of issue priorities and the member's involvement.
Issue Counts By Category:
- The chart displays the counts of issues categorized by different categories for a particular member. It offers insights into the types of issues the member is actively addressing.
Issue Counts By Identified Date Last 4 Weeks:
- This chart tracks the counts of issues identified by the member within the last four weeks. It provides a time-based perspective on the member's recent contributions.
Project-Specific Dashboards:
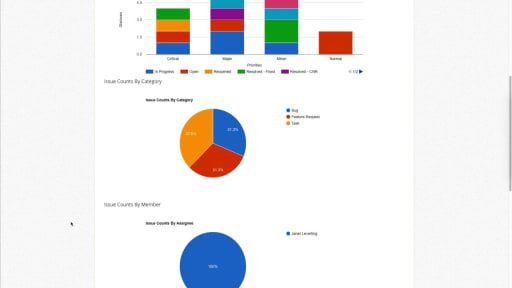
Issue Counts By Status By Priority:
- This chart offers a detailed breakdown of issue counts based on both status and priority. It provides a comprehensive view of the project's issue status and priority distribution.
Issue Counts By Category:
- The chart displays the counts of issues categorized by different categories within a specific project. It helps in understanding the distribution of issue types within the project.
Issue Counts By Member:
- This chart provides insights into the distribution of issues among project members. It helps in visualizing the workload and contributions of each team member.
Issue Counts By Identified Date Last 4 Weeks:
- The chart tracks the counts of issues identified within the last four weeks for a particular project. It offers a time-focused analysis of recent issue identification trends.
These member-specific and project-specific dashboards contribute to a transparent and data-driven project management approach, allowing teams to monitor individual performance, project progress, and key metrics for informed decision-making.
Performance Analysis at Your Fingertips
Monitor and analyze the performance of both your projects and team members. Leverage intuitive Project and Member Dashboards to access insightful analytics and identify areas for improvement.